I counted every yellow car that I saw in 2022.
Yes, it’s ridiculous, but I am addicted to counting yellow cars. I count them whenever I see them and add them to my counter which is permanently in my car.

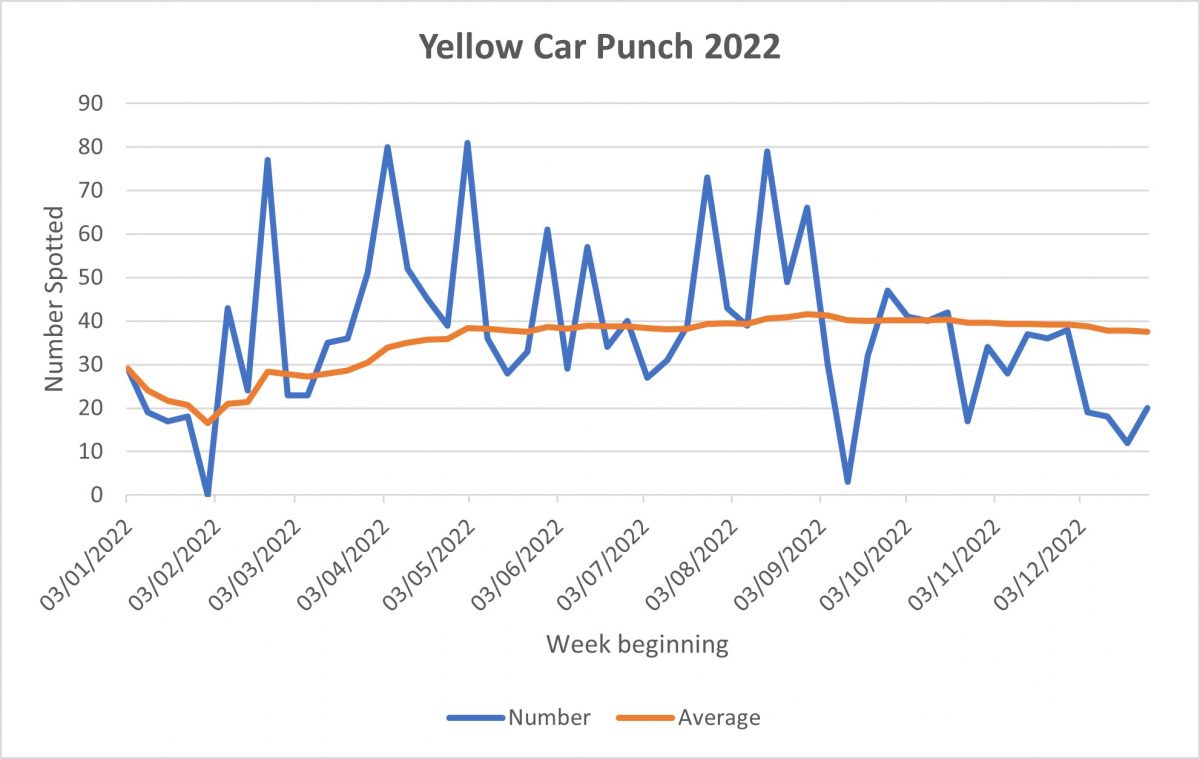
As you can see the average became fairly constant from around June onwards. The average was around 37 yellow cars each week. There are certainly more peaks during the BST months, with most of the below average weeks coming during the beginning and end of the year.
The highest weekly total was 81 which came in a week with a visit to Llandudno and a residential visit to York. It’s no surprise that the highest totals always come during the weeks with long drives, and particularly those into cities.
You can probably spot the weeks that I was off with covid (which I managed to catch twice in 2022).